Will Bitcoin’s Seasonality Go On Forever with the Halving Cycle?
Bitcoin has always been more than a “digital gold” narrative — it moves in cycles.
The halving cycle, market psychology, and even seasonality play a role in shaping Bitcoin’s price action.
With the right tools and data, these repeating patterns can give investors a 3–6 month edge in their decisions.
This article shows how to combine RiskAlpha, the Fear & Greed Index, and statistical seasonality to understand Bitcoin’s rhythm and make better investment calls.
🔄 Bitcoin’s Cyclical Nature
Every 4 years, the Bitcoin halving cuts the block reward in half, historically triggering new bull runs.
But within those large halving-driven cycles, there are smaller repeating patterns:
- 2–3 month swings of euphoria and fear
- Seasonal weakness in summer months
- End-of-year rallies when liquidity returns
The halving sets the macro framework, while seasonality and market psychology shape the shorter-term swings.
📊 The Fear & Greed Index
One of the simplest — yet most effective — tools is the Crypto Fear & Greed Index (from CoinMarketCap and others).
- Extreme Greed → often signals overheated tops.
- Extreme Fear → historically aligned with strong buying opportunities.
By tracking shifts in this index over months, investors can spot where Bitcoin stands in its emotional cycle.
📈 Forecasting with RiskAlpha
This is where tools matter. With RiskAlpha, you can:
- Upload Bitcoin and macro datasets.
- Run seasonality analysis to see which months historically bring strength or weakness.
- Model driver relationships — for example, how Bitcoin correlates with liquidity, interest rates, or tech stocks.
- Build probabilistic forecasts for the next 3–6 months.
Instead of guessing, you’re working with data-backed probabilities.
🔎 Seasonality Matters
History doesn’t repeat perfectly, but it often rhymes.
Bitcoin has shown tendencies like:
- Strength leading into Q4 (post-summer liquidity).
- Weakness during mid-cycle consolidations.
- Bullish impulses 6–12 months after halving events.
Here’s a chart visualization of Bitcoin’s seasonality:
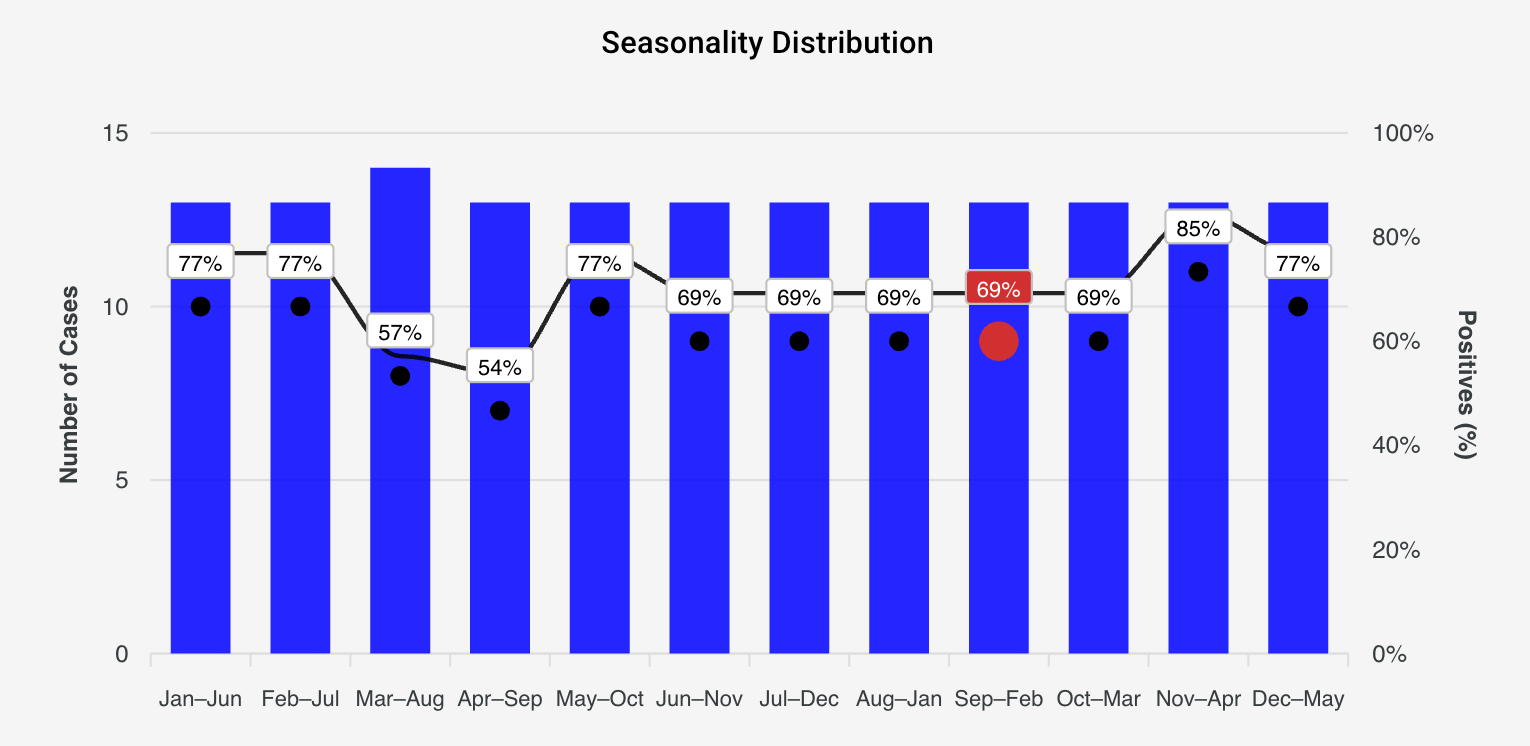
With RiskAlpha, you can statistically test these tendencies instead of relying on anecdotes.
✅ Conclusion
Bitcoin is not random — it moves in cycles shaped by the halving, market psychology, and seasonality.
By combining Fear & Greed indicators with seasonality statistics and macro forecasting tools like RiskAlpha, you can base your Bitcoin investment decisions on more than hype or hope.
For investors with a 3–6 month horizon, this approach brings discipline, structure, and clarity to navigating one of the most volatile assets in the world.
💡 Ready to forecast your own Bitcoin cycles? Try RiskAlpha and see the patterns yourself.
Bayesian Clarity — Why Finance Needs Smoothed Probabilities
How Bayesian statistics reveal the hidden structure behind uncertainty — and why smoothing probability updates is key to real financial forecasting.
Why Getting the Big Picture Right Matters in Trading
Macro forecasting is the foundation of consistent trading and investing. Here’s why multiple perspectives improve your edge — and how RiskAlpha can help.